Опис
Query Monitor is the developer tools panel for WordPress. It enables debugging of database queries, PHP errors, hooks and actions, block editor blocks, enqueued scripts and stylesheets, HTTP API calls, and more.
It includes some advanced features such as debugging of Ajax calls, REST API calls, user capability checks, and full support for block themes and full site editing. It includes the ability to narrow down much of its output by plugin or theme, allowing you to quickly determine poorly performing plugins, themes, or functions.
Query Monitor focuses heavily on presenting its information in a useful manner, for example by showing aggregate database queries grouped by the plugins, themes, or functions that are responsible for them. It adds an admin toolbar menu showing an overview of the current page, with complete debugging information shown in panels once you select a menu item.
Query Monitor supports versions of WordPress up to three years old, and PHP version 7.4 or higher.
For complete information, please see the Query Monitor website.
Here’s an overview of what’s shown for each page load:
- Database queries, including notifications for slow, duplicate, or erroneous queries. Allows filtering by query type (
SELECT,UPDATE,DELETE, etc), responsible component (plugin, theme, WordPress core), and calling function, and provides separate aggregate views for each. - The template filename, the complete template hierarchy, and names of all template parts that were loaded or not loaded (for block themes and classic themes).
- PHP errors presented nicely along with their responsible component and call stack, and a visible warning in the admin toolbar.
- Usage of “Doing it Wrong” or “Deprecated” functionality in the code on your site.
- Blocks and associated properties within post content and within full site editing (FSE).
- Matched rewrite rules, associated query strings, and query vars.
- Enqueued scripts and stylesheets, along with their dependencies, dependents, and alerts for broken dependencies.
- Language settings and loaded translation files (MO files and JSON files) for each text domain.
- HTTP API requests, with response code, responsible component, and time taken, with alerts for failed or erroneous requests.
- User capability checks, along with the result and any parameters passed to the capability check.
- Environment information, including detailed information about PHP, the database, WordPress, and the web server.
- The values of all WordPress conditional functions such as
is_single(),is_home(), etc. - Transients that were updated.
- Usage of
switch_to_blog()andrestore_current_blog()on Multisite installations.
In addition:
- Whenever a redirect occurs, Query Monitor adds an HTTP header containing the call stack, so you can use your favourite HTTP inspector or browser developer tools to trace what triggered the redirect.
- The response from any jQuery-initiated Ajax request on the page will contain various debugging information in its headers. PHP errors also get output to the browser’s developer console.
- The response from an authenticated WordPress REST API request will contain an overview of performance information and PHP errors in its headers, as long as the authenticated user has permission to view Query Monitor’s output. An an enveloped REST API request will include even more debugging information in the
qmproperty of the response.
By default, Query Monitor’s output is only shown to Administrators on single-site installations, and Super Admins on Multisite installations.
In addition to this, you can set an authentication cookie which allows you to view Query Monitor output when you’re not logged in (or if you’re logged in as a non-Administrator). See the Settings panel for details.
Other Plugins
I maintain several other plugins for developers. Check them out:
- User Switching provides instant switching between user accounts in WordPress.
- WP Crontrol lets you view and control what’s happening in the WP-Cron system
Privacy Statement
Query Monitor is private by default and always will be. It does not persistently store any of the data that it collects. It does not send data to any third party, nor does it include any third party resources.
Query Monitor’s full privacy statement can be found here.
Accessibility Statement
Query Monitor aims to be fully accessible to all of its users. It implements best practices for web accessibility, outputs semantic and structured markup, uses the accessibility APIs provided by WordPress and web browsers where appropriate, and is fully accessible via keyboard.
That said, Query Monitor does not conform to the Web Content Accessibility Guidelines (WCAG) 2.0 at level AA like WordPress itself does. The main issue is that the user interface uses small font sizes to maintain a high information density for sighted users. Users with poor vision or poor motor skills may struggle to view or interact with some areas of Query Monitor because of this. This is something which I’m acutely aware of and which I work to gradually improve, but the underlying issue of small font sizes remains.
If you’ve experienced or identified another accessibility issue in Query Monitor, please open a thread in the Query Monitor plugin support forum and I’ll try my best to address it swiftly.
Скріншоти
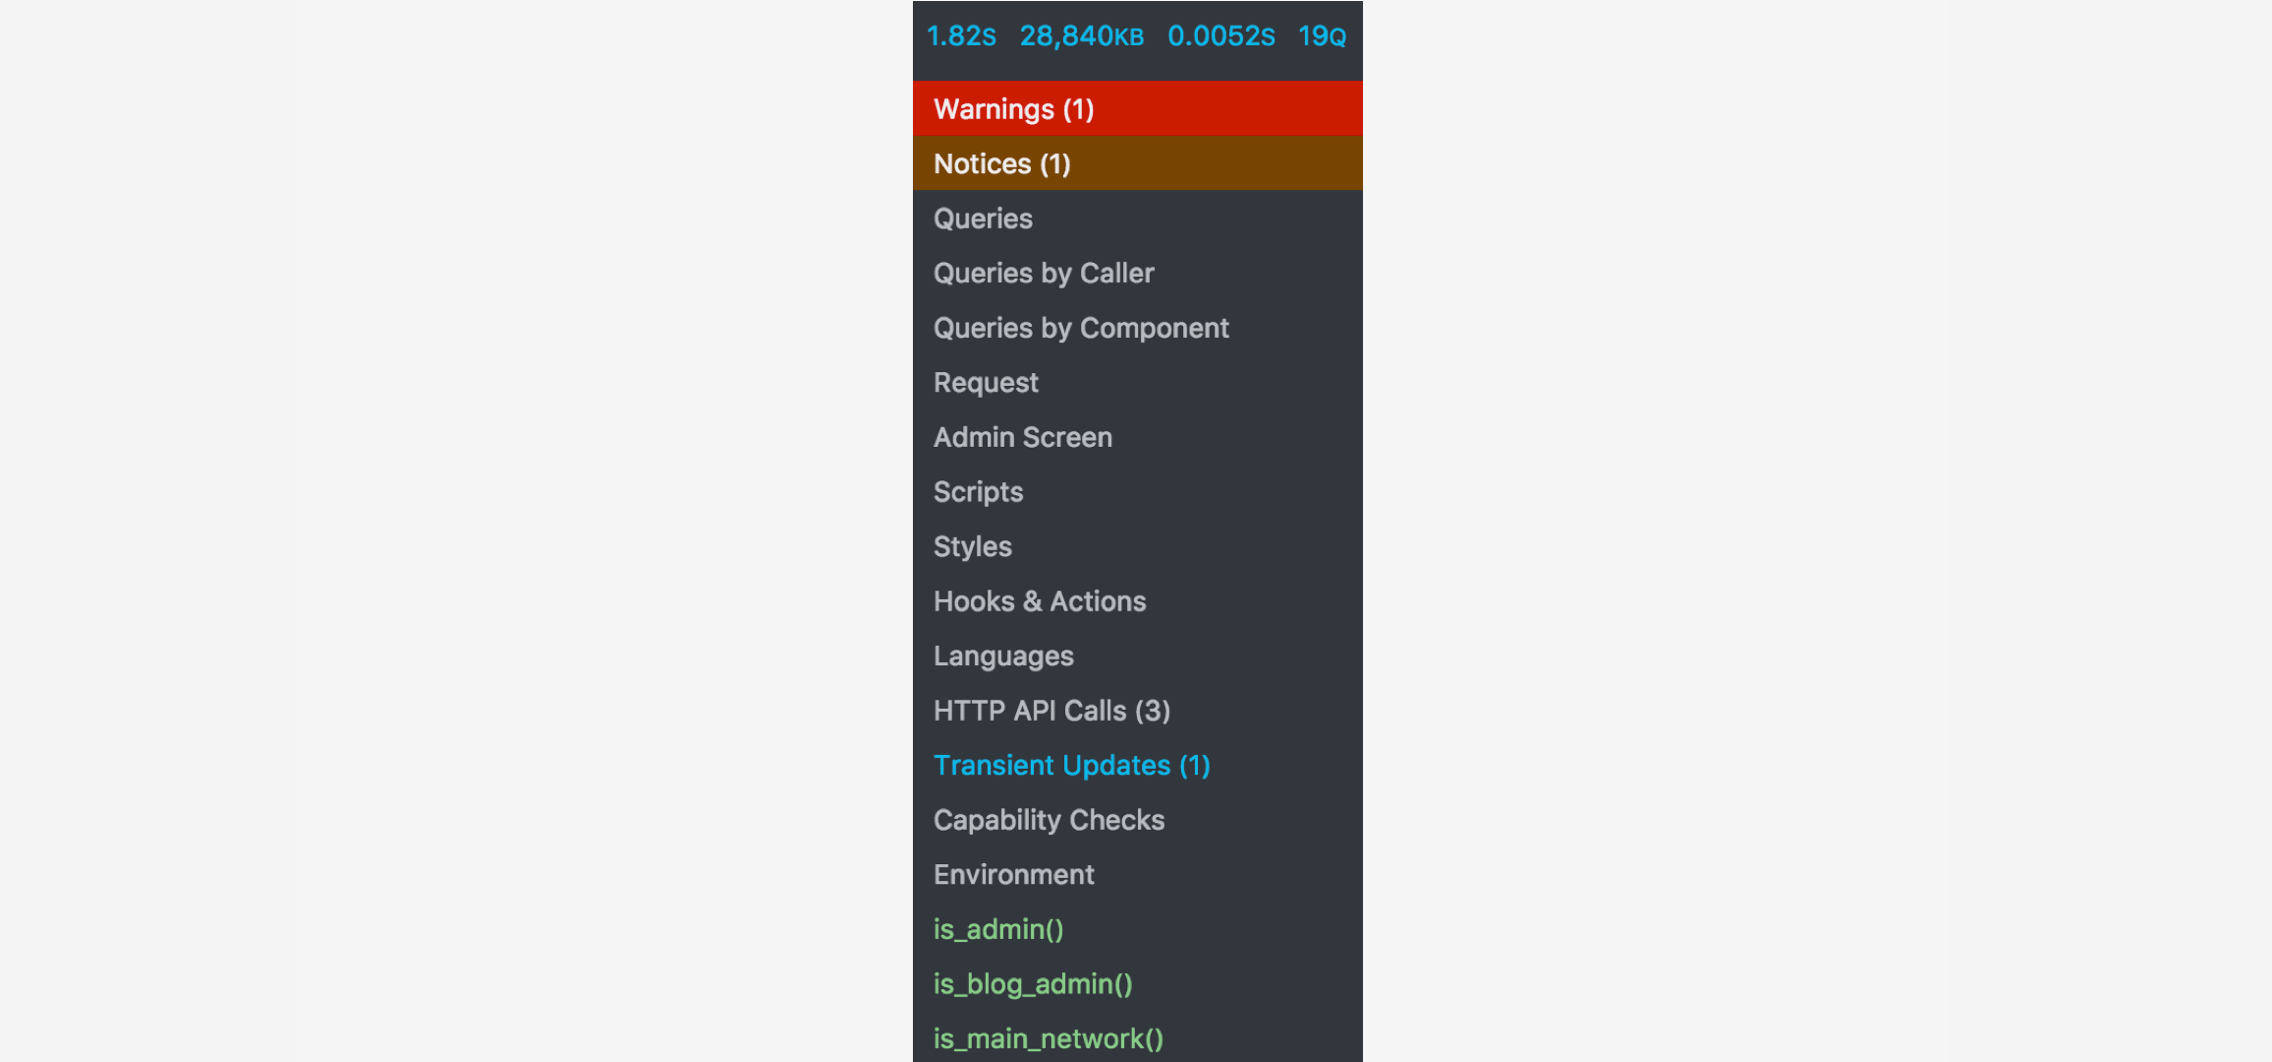
Admin Toolbar Menu 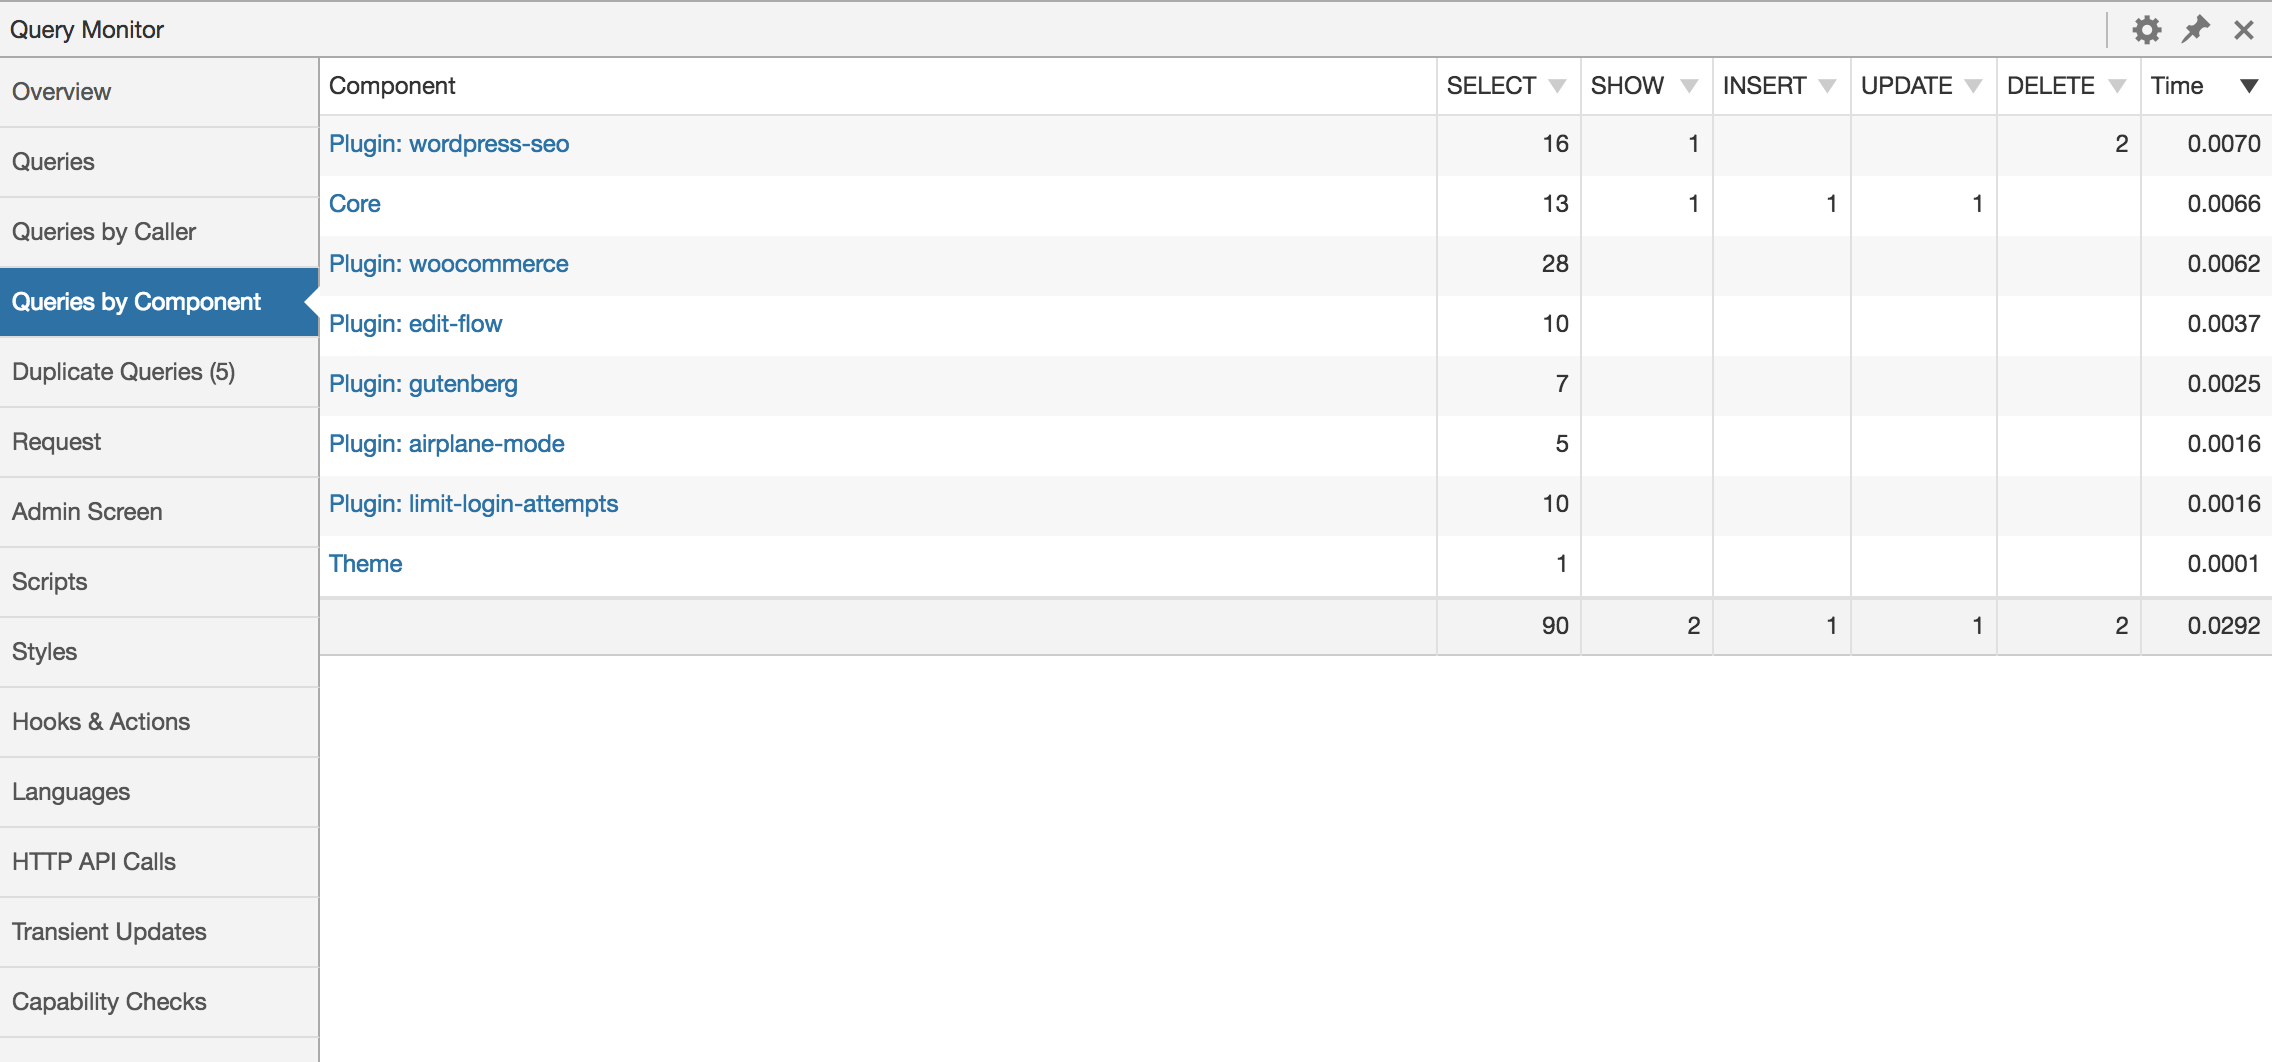
Aggregate Database Queries by Component 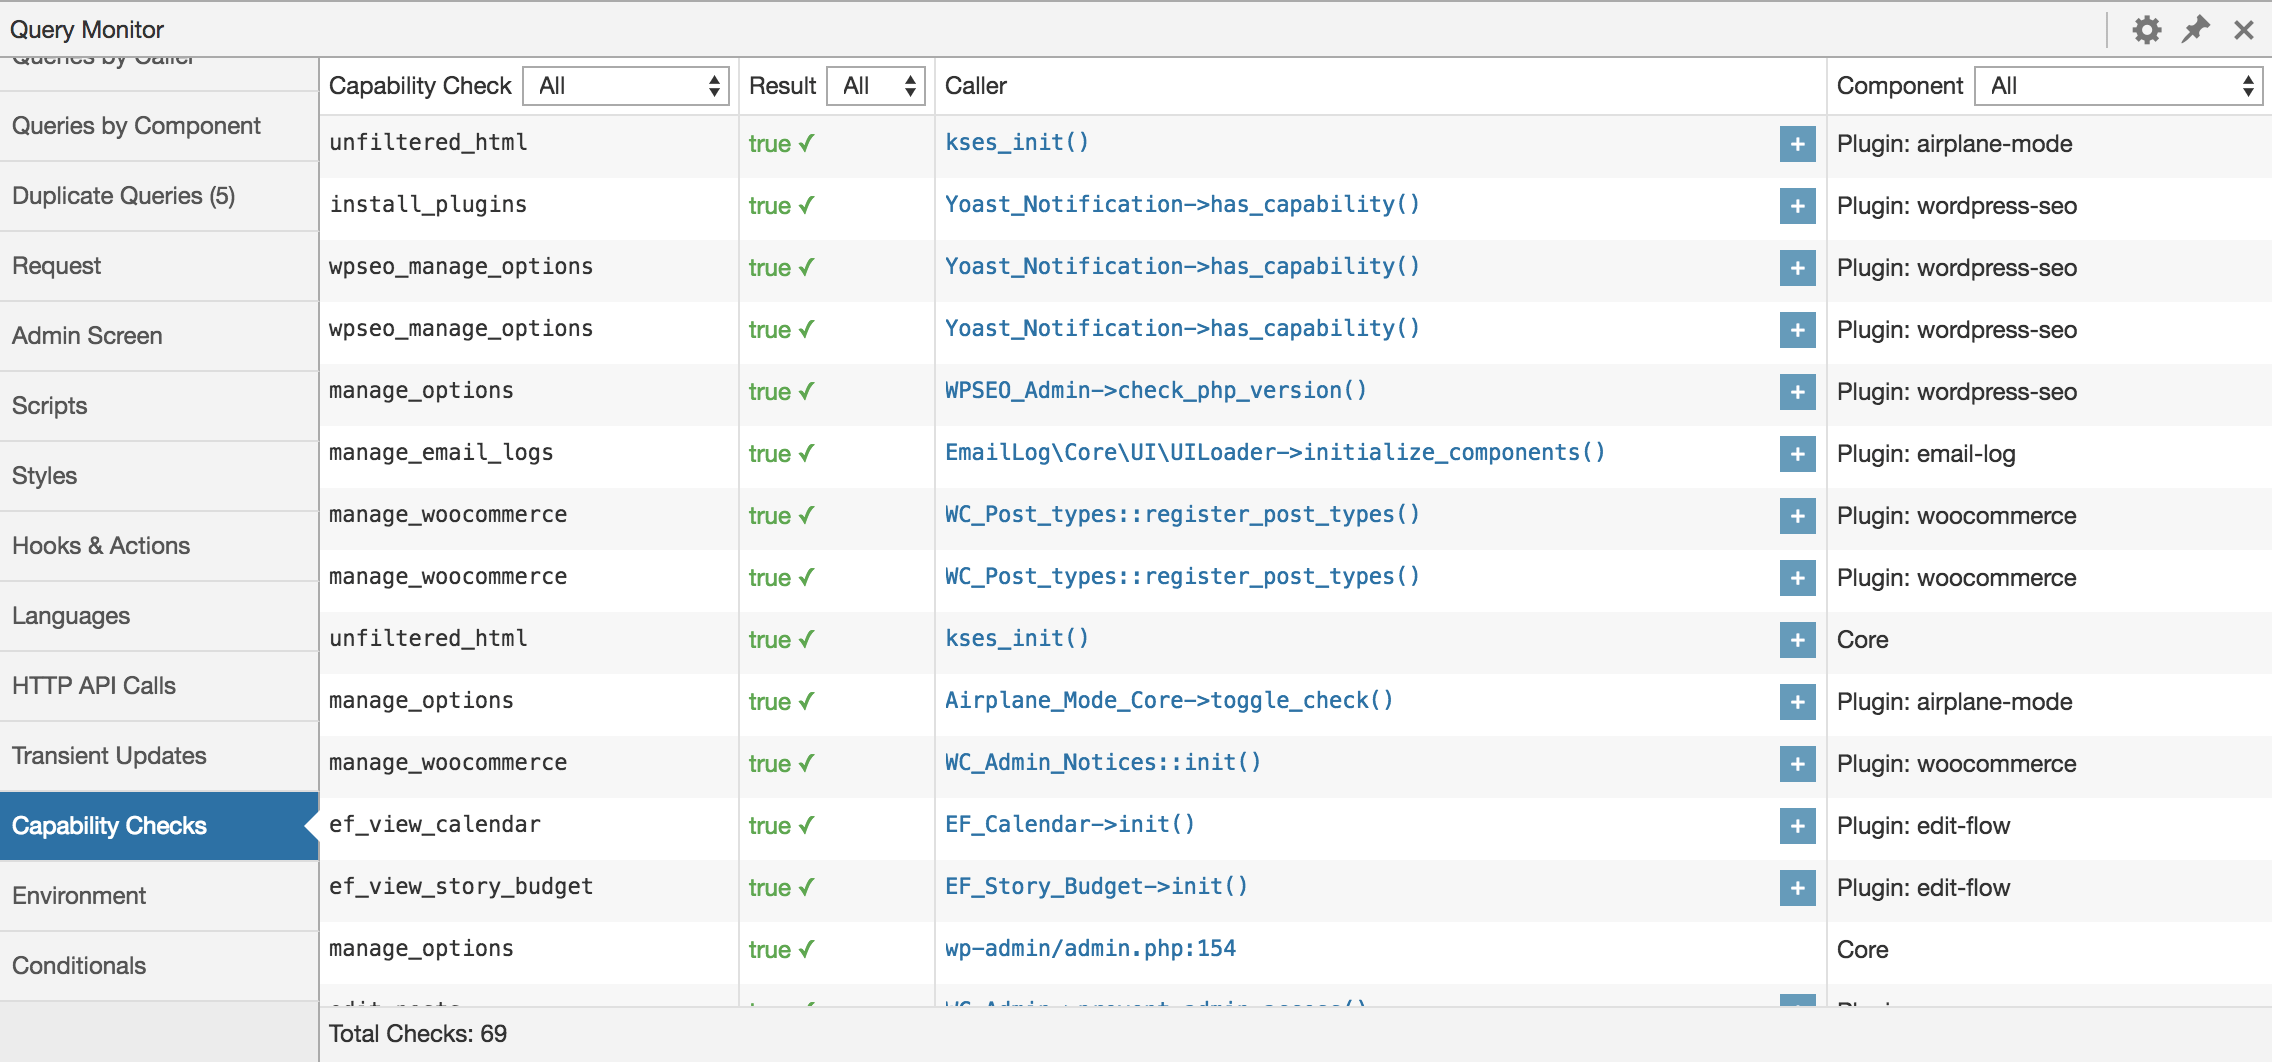
Capability Checks 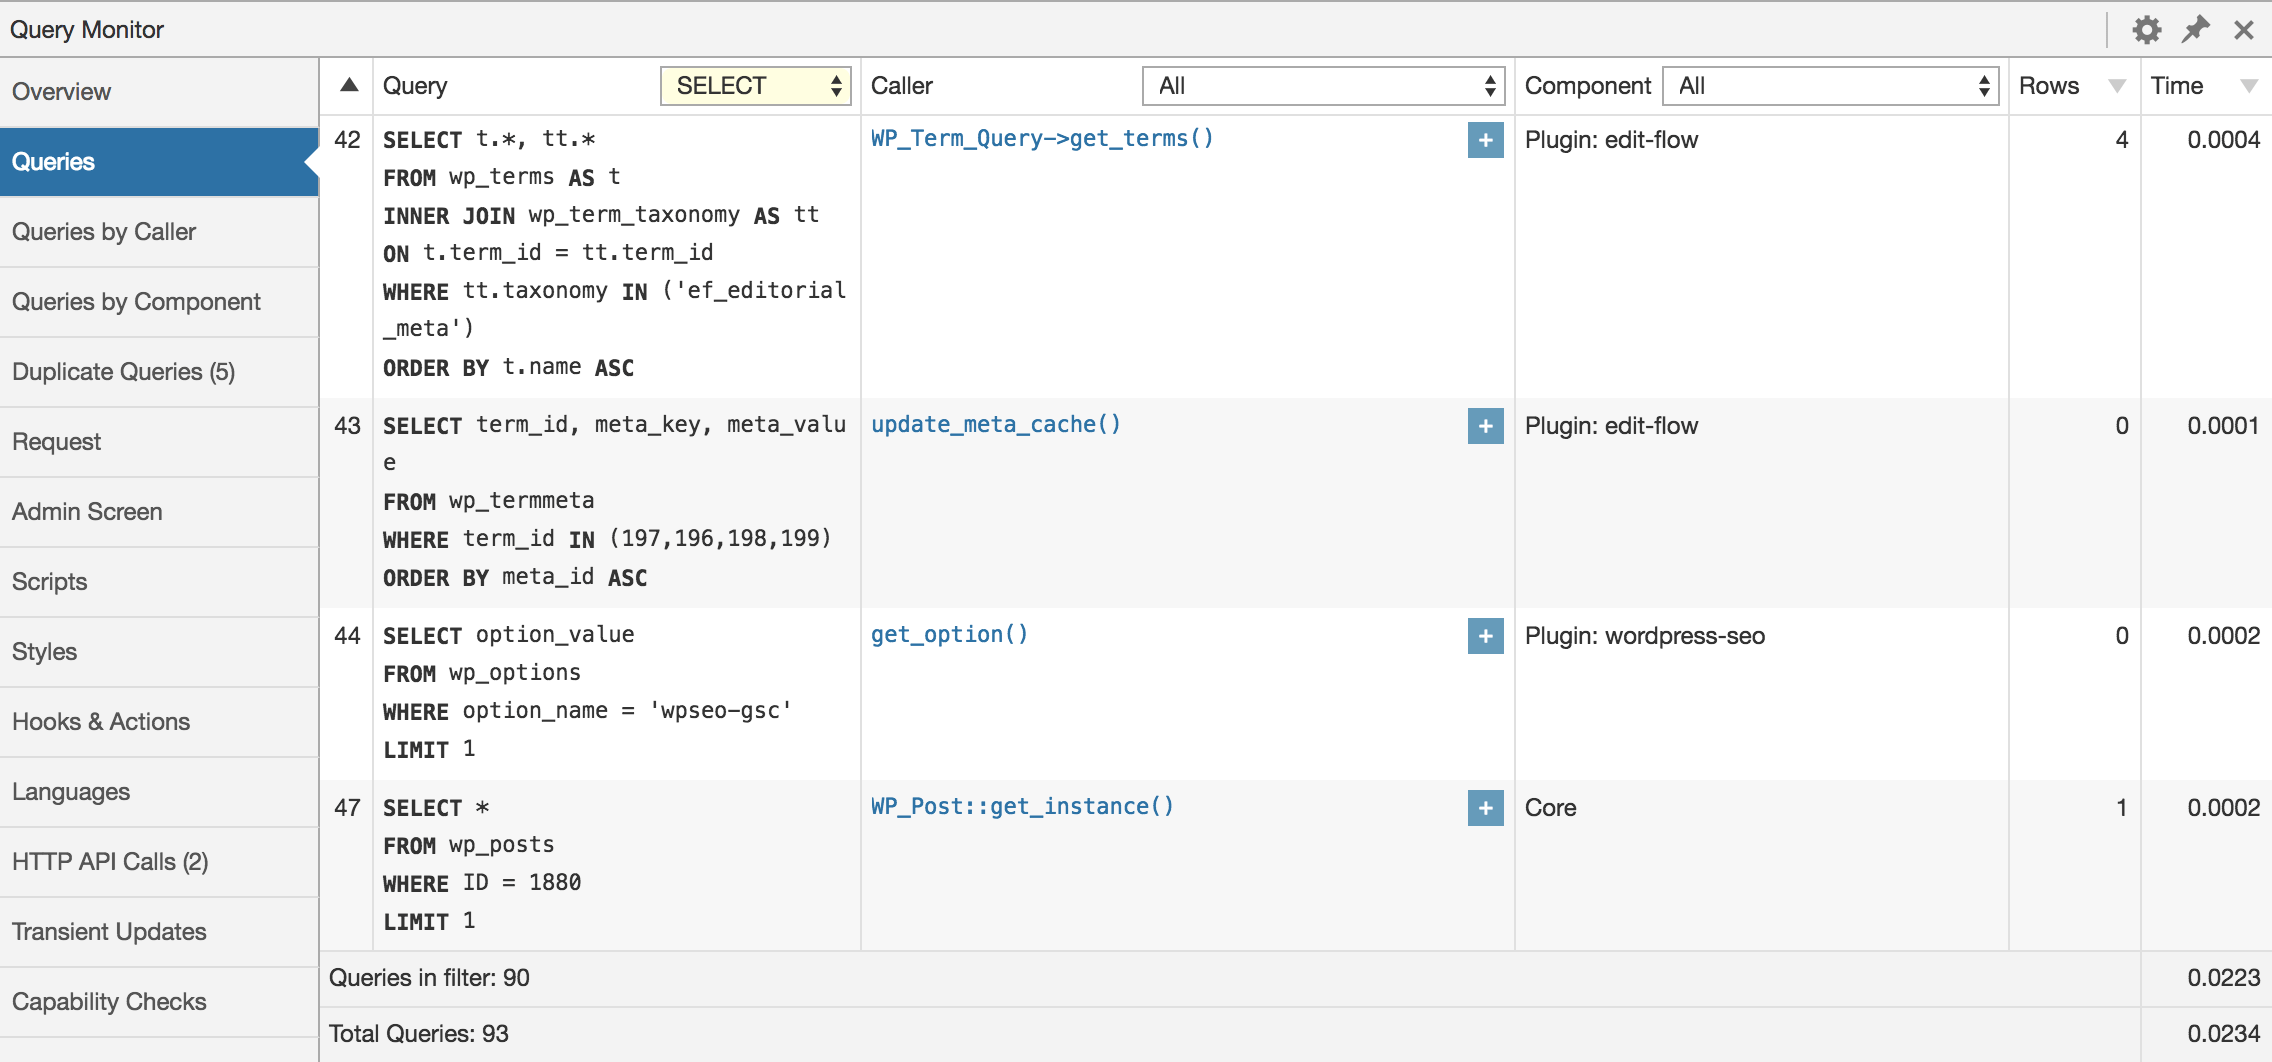
Database Queries 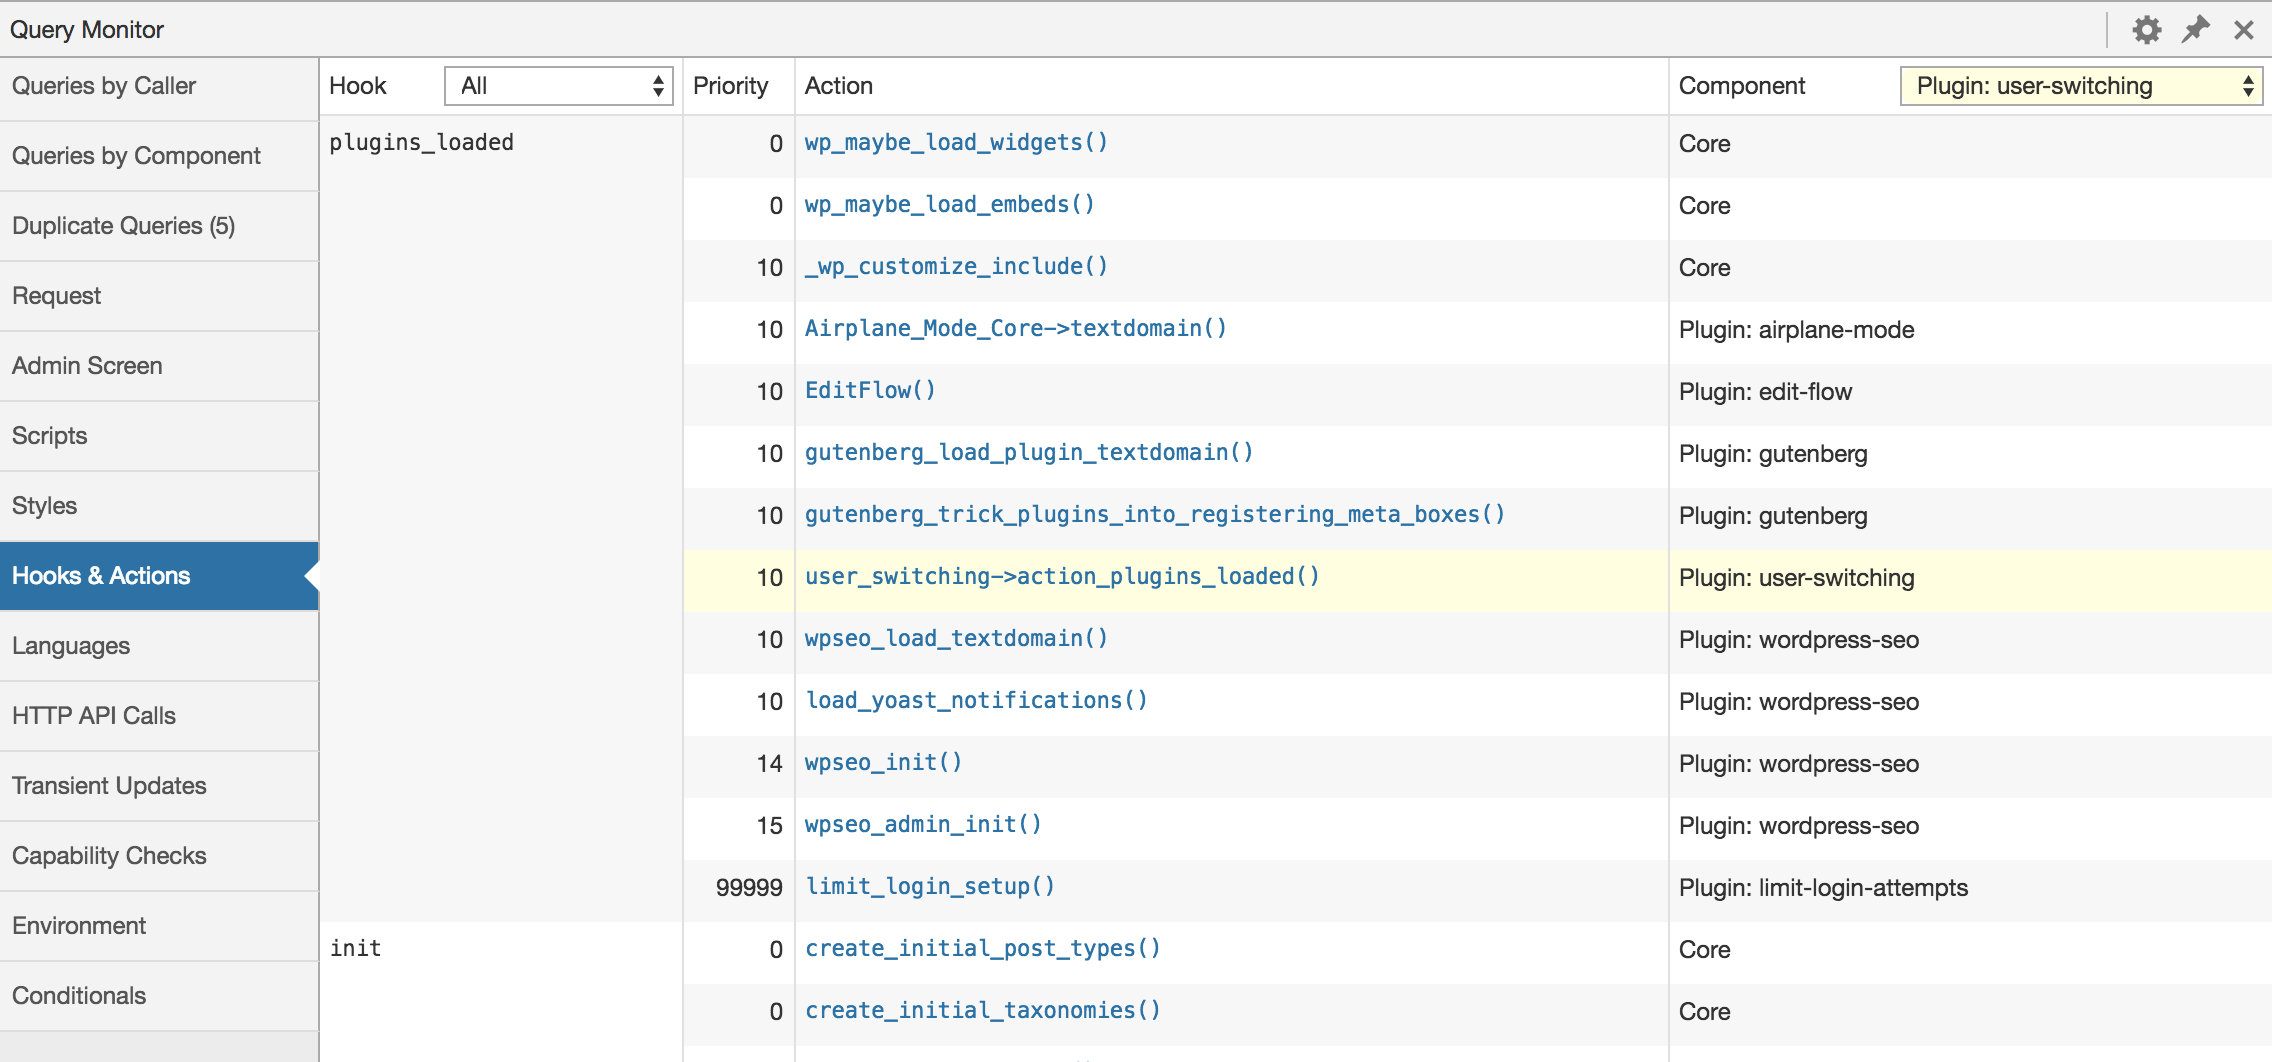
Hooks and Actions 
HTTP API Requests 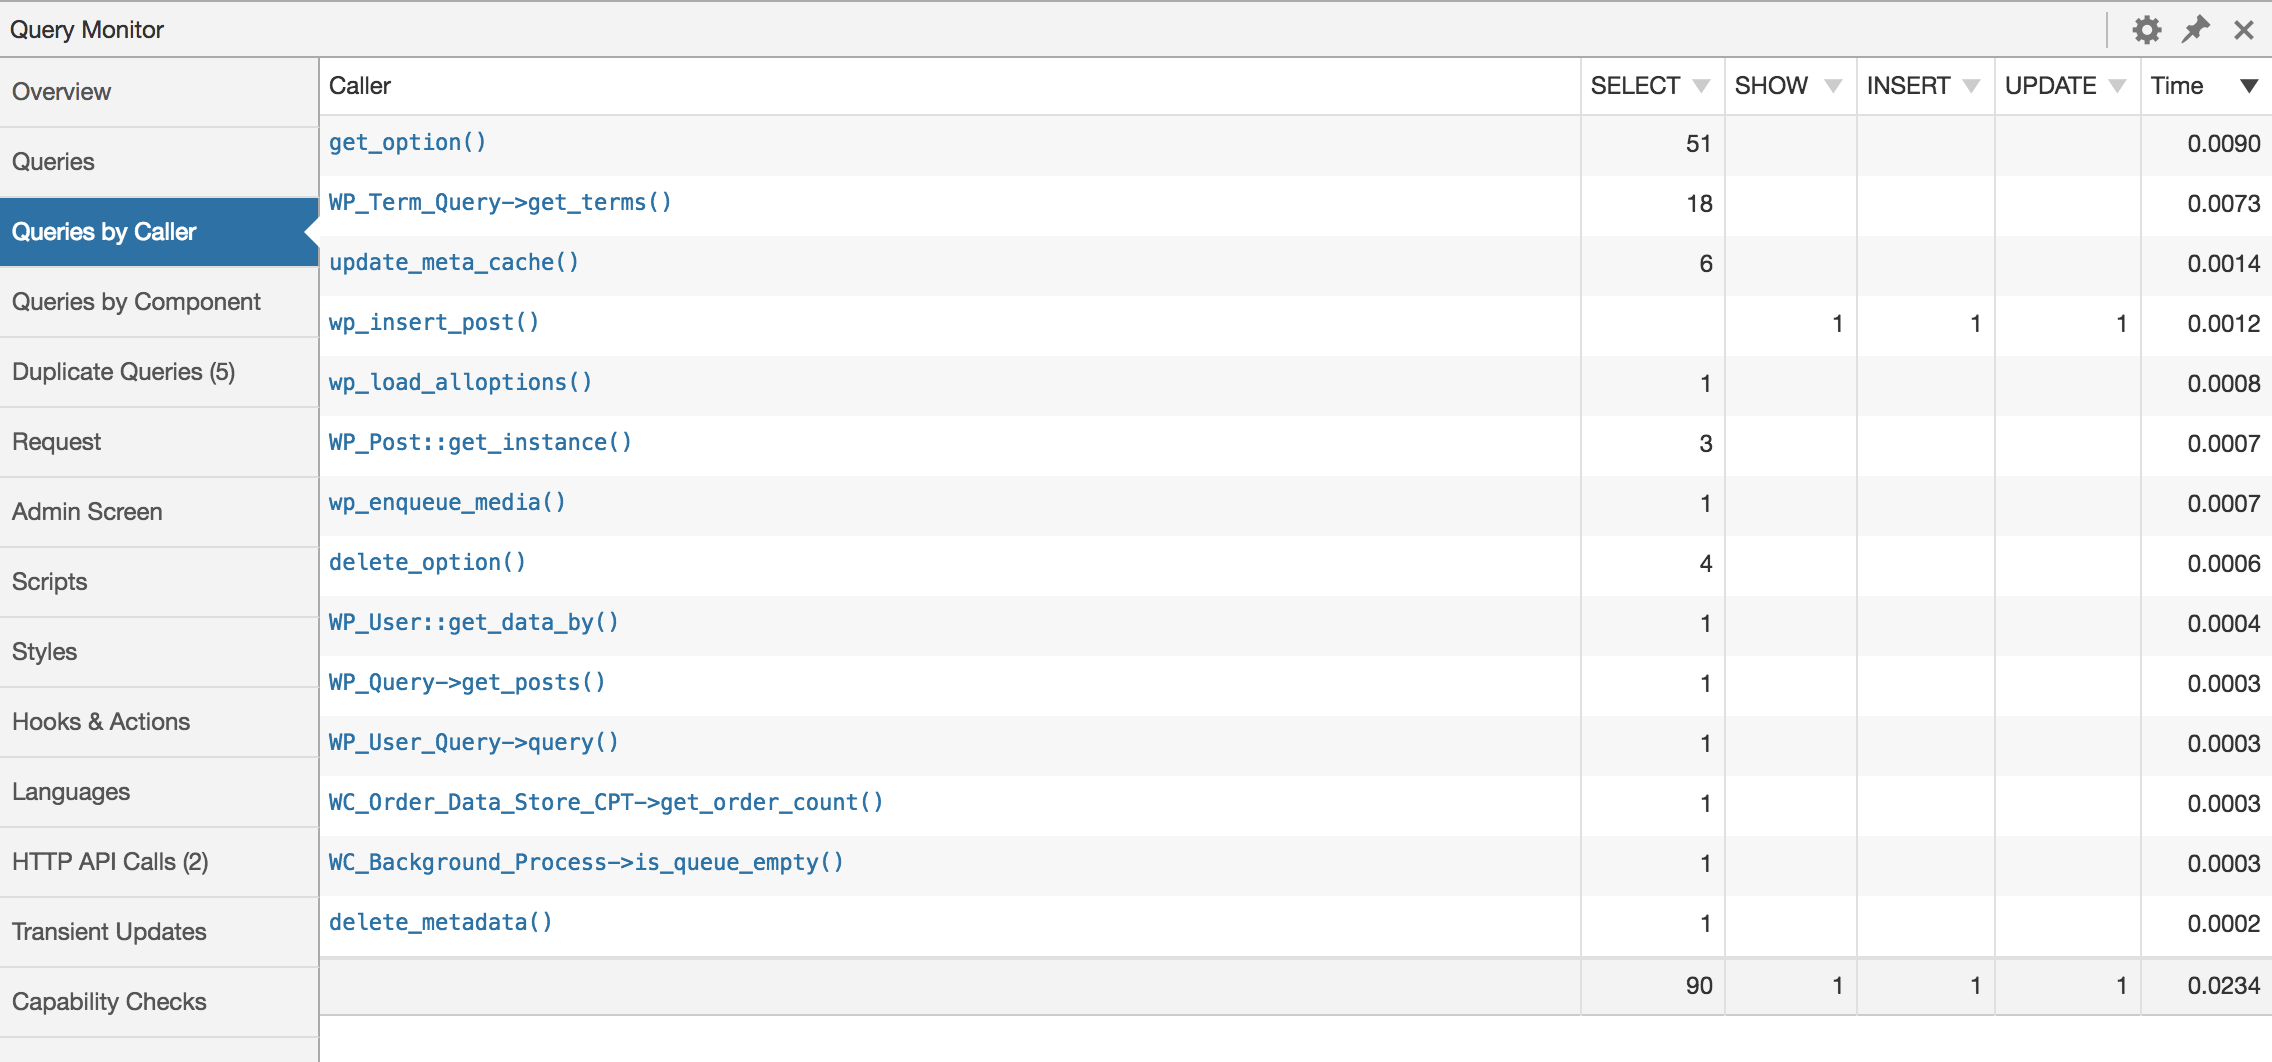
Aggregate Database Queries by Calling Function
Часті питання
-
Does this plugin work with PHP 8?
-
Yes, it’s actively tested and working up to PHP 8.2.
-
Who can access Query Monitor’s output?
-
By default, Query Monitor’s output is only shown to Administrators on single-site installations, and Super Admins on Multisite installations.
In addition to this, you can set an authentication cookie which allows you to view Query Monitor output when you’re not logged in, or when you’re logged in as a user who cannot usually see Query Monitor’s output. See the Settings panel for details.
-
Does Query Monitor itself impact the page generation time or memory usage?
-
Short answer: Yes, but only a little.
Long answer: Query Monitor has a small impact on page generation time because it hooks into WordPress in the same way that other plugins do. The impact is low; typically between 10ms and 100ms depending on the complexity of your site.
Query Monitor’s memory usage typically accounts for around 10% of the total memory used to generate the page.
-
Can I prevent Query Monitor from collecting data during long-running requests?
-
Yes, if anything calls
do_action( 'qm/cease' )then Query Monitor will cease operating for the remainder of the page generation. It detaches itself from further data collection, discards any data it’s collected so far, and skips the output of its information.This is useful for long-running operations that perform a very high number of database queries, consume a lot of memory, or otherwise are of no concern to Query Monitor, for example:
- Backing up or restoring your site
- Exporting a large amount of data
- Running security scans
-
Are there any add-on plugins for Query Monitor?
-
A list of add-on plugins for Query Monitor can be found here.
In addition, Query Monitor transparently supports add-ons for the Debug Bar plugin. If you have any Debug Bar add-ons installed, deactivate Debug Bar and the add-ons will show up in Query Monitor’s menu.
-
Where can I suggest a new feature or report a bug?
-
Please use the issue tracker on Query Monitor’s GitHub repo as it’s easier to keep track of issues there, rather than on the wordpress.org support forums.
-
Is Query Monitor available on Altis?
-
Yes, the Altis Developer Tools are built on top of Query Monitor.
-
Is Query Monitor available on WordPress VIP?
-
Yes, but a user needs to be granted the
view_query_monitorcapability to see Query Monitor even if they’re an administrator. See the WordPress VIP documentation for more details. -
I’m using multiple instances of `wpdb`. How do I get my additional instances to show up in Query Monitor?
-
This feature was removed in version 3.12 as it was rarely used and considerably increased the maintenance burden of Query Monitor itself. Feel free to continue using version 3.11 if you need to make use of this feature.
-
Can I click on stack traces to open the file in my editor?
-
Yes. You can enable this on the Settings panel.
-
Do you accept donations?
-
I am accepting sponsorships via the GitHub Sponsors program. If you work at an agency that develops with WordPress, ask your company to provide sponsorship in order to invest in its supply chain. The tools that I maintain probably save your company time and money, and GitHub sponsorship can now be done at the organisation level.
In addition, if you like the plugin then I’d love for you to leave a review. Tell all your friends about it too!
Відгуки
Учасники та розробники
“Query Monitor” — проект з відкритим вихідним кодом. В розвиток плагіну внесли свій вклад наступні учасники:
Учасники“Query Monitor” було перекладено на 23 локалізації. Дякуємо перекладачам за їх роботу.
Перекладіть “Query Monitor” на вашу мову.
Цікавитесь розробкою?
Перегляньте код, перегляньте сховище SVN або підпишіться на журнал розробки за допомогою RSS.
Журнал змін
3.15.0 (10 November 2023)
- Adds a new assertion feature via the
qm/assertaction - Confirms the plugin is tested up to WordPress 6.4
3.14.1 (21 October 2023)
- Improves compatibility with WordPress Playground
3.14.0 (18 October 2023)
- Corrects the port number handling when displaying URLs for scripts and styles
- Improves the
db.phphandling when activating and deactivating Query Monitor on a single site within a Multisite network, and whenDISALLOW_FILE_MODSis in use - Improves check for Debug Bar existence
- Identifies drop-in plugins as a specific component instead of “other”
- Simplifies some of the data structure used when logging queries
- Specifies that Query Monitor supports WordPress versions up to three years old
3.13.1 (15 July 2023)
- Avoids a fatal error if a deprecated warning is triggered early on during the bootstrap process
- Avoids a PHP warning that can be triggered during certain HTTP API requests when Curl is not in use
- Skips loading QM during the plugin update process
3.13.0 (9 July 2023)
- Adds a dedicated panel for “Doing it Wrong” and deprecated functionality usage
- Allows data in the HTTP API requests panel to be filtered by host name
- Adds a “Type” column wherever a list of hooks can show both actions and filters
- Improves various aspects of the “Editor” setting
- Increases the minimum supported version of PHP to 7.4
- Many thanks to @crstauf for the majority of the new features in this release
3.12.3 (17 May 2023)
- Improves theme template part data collection when the Gutenberg plugin is in use with a block theme
- Skips attempting to resolve a block template if the theme doesn’t support block templates
- Removes the fallback to
$EZSQL_ERRORfor database query errors as it’s not possible to determine if the error should be ignored
3.12.2 (27 April 2023)
- Adds the total count to the table footer of the PHP Errors panel
- Improves the destination URL for links that point to the site editor
- Implements some minor visual improvements
- Removes unreliable information about the transport for HTTP API requests
- Removes Query Monitor output from the interim login modal
3.12.1 (24 March 2023)
- Corrects some inter-panel links that point to the Queries panel and sub-panels
- Switches to
sessionStoragefor the selected table column filters so they don’t persist across tabs or sessions - Removes the “Debug Bar:” prefix on the menus for panels inherited from the Debug Bar plugin
3.12.0 (16 March 2023)
- Clarifies and improves information in the Template panel when a block theme or full site editing (FSE) is in use
- Avoids PHP warnings if a third party plugin makes unexpected changes to language file paths
- Implements some minor performance improvements
- Removes misleading information about WordPress memory limits
- Removes support for multiple instances of
wpdb(see the FAQ for more information)
3.11.2 (23 February 2023)
- Implements various accessibility improvements
- Fixes an issue where not all admin area footer scripts were shown in the Scripts panel
- Improves output when the SQLite feature in the Performance Labs plugin is in use
- Removes QM output altogether from the Customizer
- Ensures
wp-content/db.phpfrom another plugin doesn’t get removed when deactivating QM
3.11.1 (3 January 2023)
- Avoids a fatal error in PHP 8 when
posix_getpwuid()orposix_getgrgid()doesn’t return an expected value.
3.11.0 (30 December 2022)
- Adds a new “Multisite” panel that shows usage of
switch_to_blog()andrestore_current_blog()on Multisite installations - Improves the output shown for blocks and template parts when block themes or full site editing is in use
- Introduces new
QM_DataandQM_Componentclasses to make the data collection more structured and reliable - Increases the minimum supported version of PHP to 7.2
- Improves the performance of SVG icons
- Removes the ability to completely hide silenced PHP errors
- Avoids some deprecated notices in PHP 8.2
- Improves the performance of the PHP class autoloader
3.10.1 (9 September 2022)
- Prevents logging duplicate entries for multiple calls to load the same translation file
- Brings the dispatcher priority back down to
9for maximum compatibility with other plugins that use a shutdown handler
3.10.0 (8 September 2022)
- Adds information about the current language on the Languages panel
- Reduces the chance that Query Monitor blames itself for PHP errors that don’t have a stack trace
- Replaces the use of Dashicons with inline SVGs and removes the
dashiconsdependency - Switches to class autoloading via Composer for reduced memory usage
- Changes the priority of the
shutdowndispatcher from0toPHP_INT_MAXto ensure as much data as possible is collected - Improves the styling of Debug Bar add-ons
- Fixes some erroneous localisation of float values in REST API output
- Bumps the minimum supported PHP version to 5.6
- Improves various other bits and bobs
3.9.0 (15 April 2022)
- Introduces a dark mode toggle on the Settings panel, which replaces the
QM_DARK_MODEconstant - Prevents errors with undefined constants being reported in
db.php - Adds more comprehensive handling of unexpected values in stack traces
- Fixes PHP Warning ‘Header may not contain NUL bytes’ when outputting headers
3.8.2 (7 January 2022)
- Fixes some deprecated notices with PHP 8.1
- Improves the handling of SQL queries that consist only of MySQL comments
3.8.1 (2 January 2022)
- Fixes an incompatibility with PHP versions prior to 7.2
- Fixes a warning that was being triggered within the PHP header dispatcher
- Introduces the
qm/component_type/{$type}filter - Introduces a
QM_VERSIONconstant
3.8.0 (27 December 2021)
- Introduces the ability for a third party to cease all further data collection and output at any point by calling
do_action( 'qm/cease' ), for example to prevent memory exhaustion during long-running operations - Reduces the width of the admin toolbar menu item by using lower decimal precision
- Improves the Template panel information when a block theme is in use (for Full Site Editing)
- Improves the performance and accuracy of stack traces and calling function information
- Corrects some formatting of numbers and error messages in the REST API output
- Adds more useful information when a persistent object cache or opcode cache isn’t in use
- Improves clarity in the Scripts and Styles panels when any of the URLs include a port number
- Introduces the
qm/component_context/{$type}filter to complementqm/component_name/{$type}andqm/component_dirs - Improves internal code quality, internationalisation, and further reduces overall memory usage
3.7.1 (13 May 2021)
- Add a fallback for timing processing during Ajax requests that are dispatched before the
shutdownhook.
3.7.0 (13 May 2021)
- Introduce debugging output in a
qmproperty in enveloped REST API responses - Add HTTP API call information to the overview panel
- Don’t show QM output inside WordPress embeds as nobody uses this
- Don’t try to access the
QM_HIDE_SELFconstant before it’s defined - Process the timing and memory related stats as early as possible so the data isn’t too skewed
3.6.8 (9 May 2021)
- Add WordPress memory usage statistic to Overview panel
- Add block context information to the Blocks panel
- Fix row highlighting of TH cells
- Fix some panel resizing bugs
3.6.7 (20 January 2021)
- Implement a
QM_DB_SYMLINKconstant to prevent thedb.phpsymlink being put into place. - Remove a dependency on
SAVEQUERIESin the query collector. - Remove invalid
scopeattributes on table cells.
3.6.6 (13 January 2021)
- PHP 8 fix.
- Improve the display for various empty values when logging.
- Don’t display child menus until the parent menu is active. Makes the menu clearer.
- Detect local host names in HTTP API requests and don’t mark them as ignoring certificate verification.
- Prevent the text in toggle buttons from being selected when selecting data in tables.
- Remove support for the Dark Mode plugin which isn’t Dark Mode any more.
3.6.5 (13 November 2020)
- Always show the Logs panel, with a link to help docs.
- Whole bunch of improvements to QM’s “broken” state handling.
- Remove usage of deprecated jQuery methods.
- Add support for Altis dependencies as components.
- Add
innodb_buffer_pool_sizevariable to the mysql environment list. - Preformat the Logger output
- Fix the PHP version check.
3.6.4 (20 August 2020)
- Correct an error introduced in 3.6.2 with the extra early error handling (ironic).
3.6.3 (20 August 2020)
- Correct the size of the close icon.
3.6.2 (20 August 2020)
- Capture and display the most recent PHP error that occurred before QM loaded.
- Add support for the environment type added in WP 5.5.
- Avoid a potentially blank translation for some plural forms.
- Increase some contrast in dark mode.
- Combine the response-related sections of the Request panel.
- Add extra sanity checking when attempting to fetch the posix user information.
3.6.1 (25 July 2020)
- Adjust the bottom margin when the QM panel is open so QM doesn’t cover the bottom of the page. Works more often than not.
- Prevent QM from triggering a fatal itself if a fatal occurs before the HTML dispatcher is loaded.
- Add an informational message to the template output when template hooks are in use.
- Fix errors caused by missing user or group IDs when collecting environment data.
- Add TextMate to list of supported editors.
- Demote some cache warnings to informational messages.
- Support passing backtrace to
QM_Backtrace.
3.6.0 (8 May 2020)
- Improvements to the UI when a fatal error occurs, including an admin toolbar warning.
- Improvements to the UI when QM is running in “broken” mode due to missing jQuery or an unrecoverable JavaScript error.
- Don’t display fatal errors if error display is off and the user cannot view QM.
- Improvements to the visual appearance of the
wp_die()output. - Simplify re-throwing a caught exception so QM doesn’t get the blame for fatal errors, eg. in the WordPress core fatal error handler.
- Add support for logging a variable of any type in the logger, as a replacement for var dumping.
- Don’t show a message for errors in Ajax calls that have already occurred on the main page load.
- Don’t dispatch QM during an iframed request, eg the plugin info modal or an upgrader action.
- Hide QM itself from various panels by default to remove noise. Can be controlled via the existing
QM_HIDE_SELFconfiguration constant. - Support for the new
is_favicon()conditional added in WP 5.4. - Fix the side panel resizing functionality.
- Add a WP-CLI command for creating the symlink to the db file.
- Add filters to
QM_Util::get_file_dirs()andget_file_component()to allow support for non-standard plugin and theme locations. - Add an action that fires when QM enqueues its assets, so add-on plugins can enqueue theirs only when necessary.
3.5.2 (2 December 2019)
- Add support for exposing Full Site Editing blocks in the Block Editor panel.